Our standardised objective ADHD tests, QbTest and QbCheck, focus on the three core symptoms of ADHD – hyperactivity, inattention, and impulsivity, providing results through the use of activity tracking and responses to stimuli on a computer-based task.
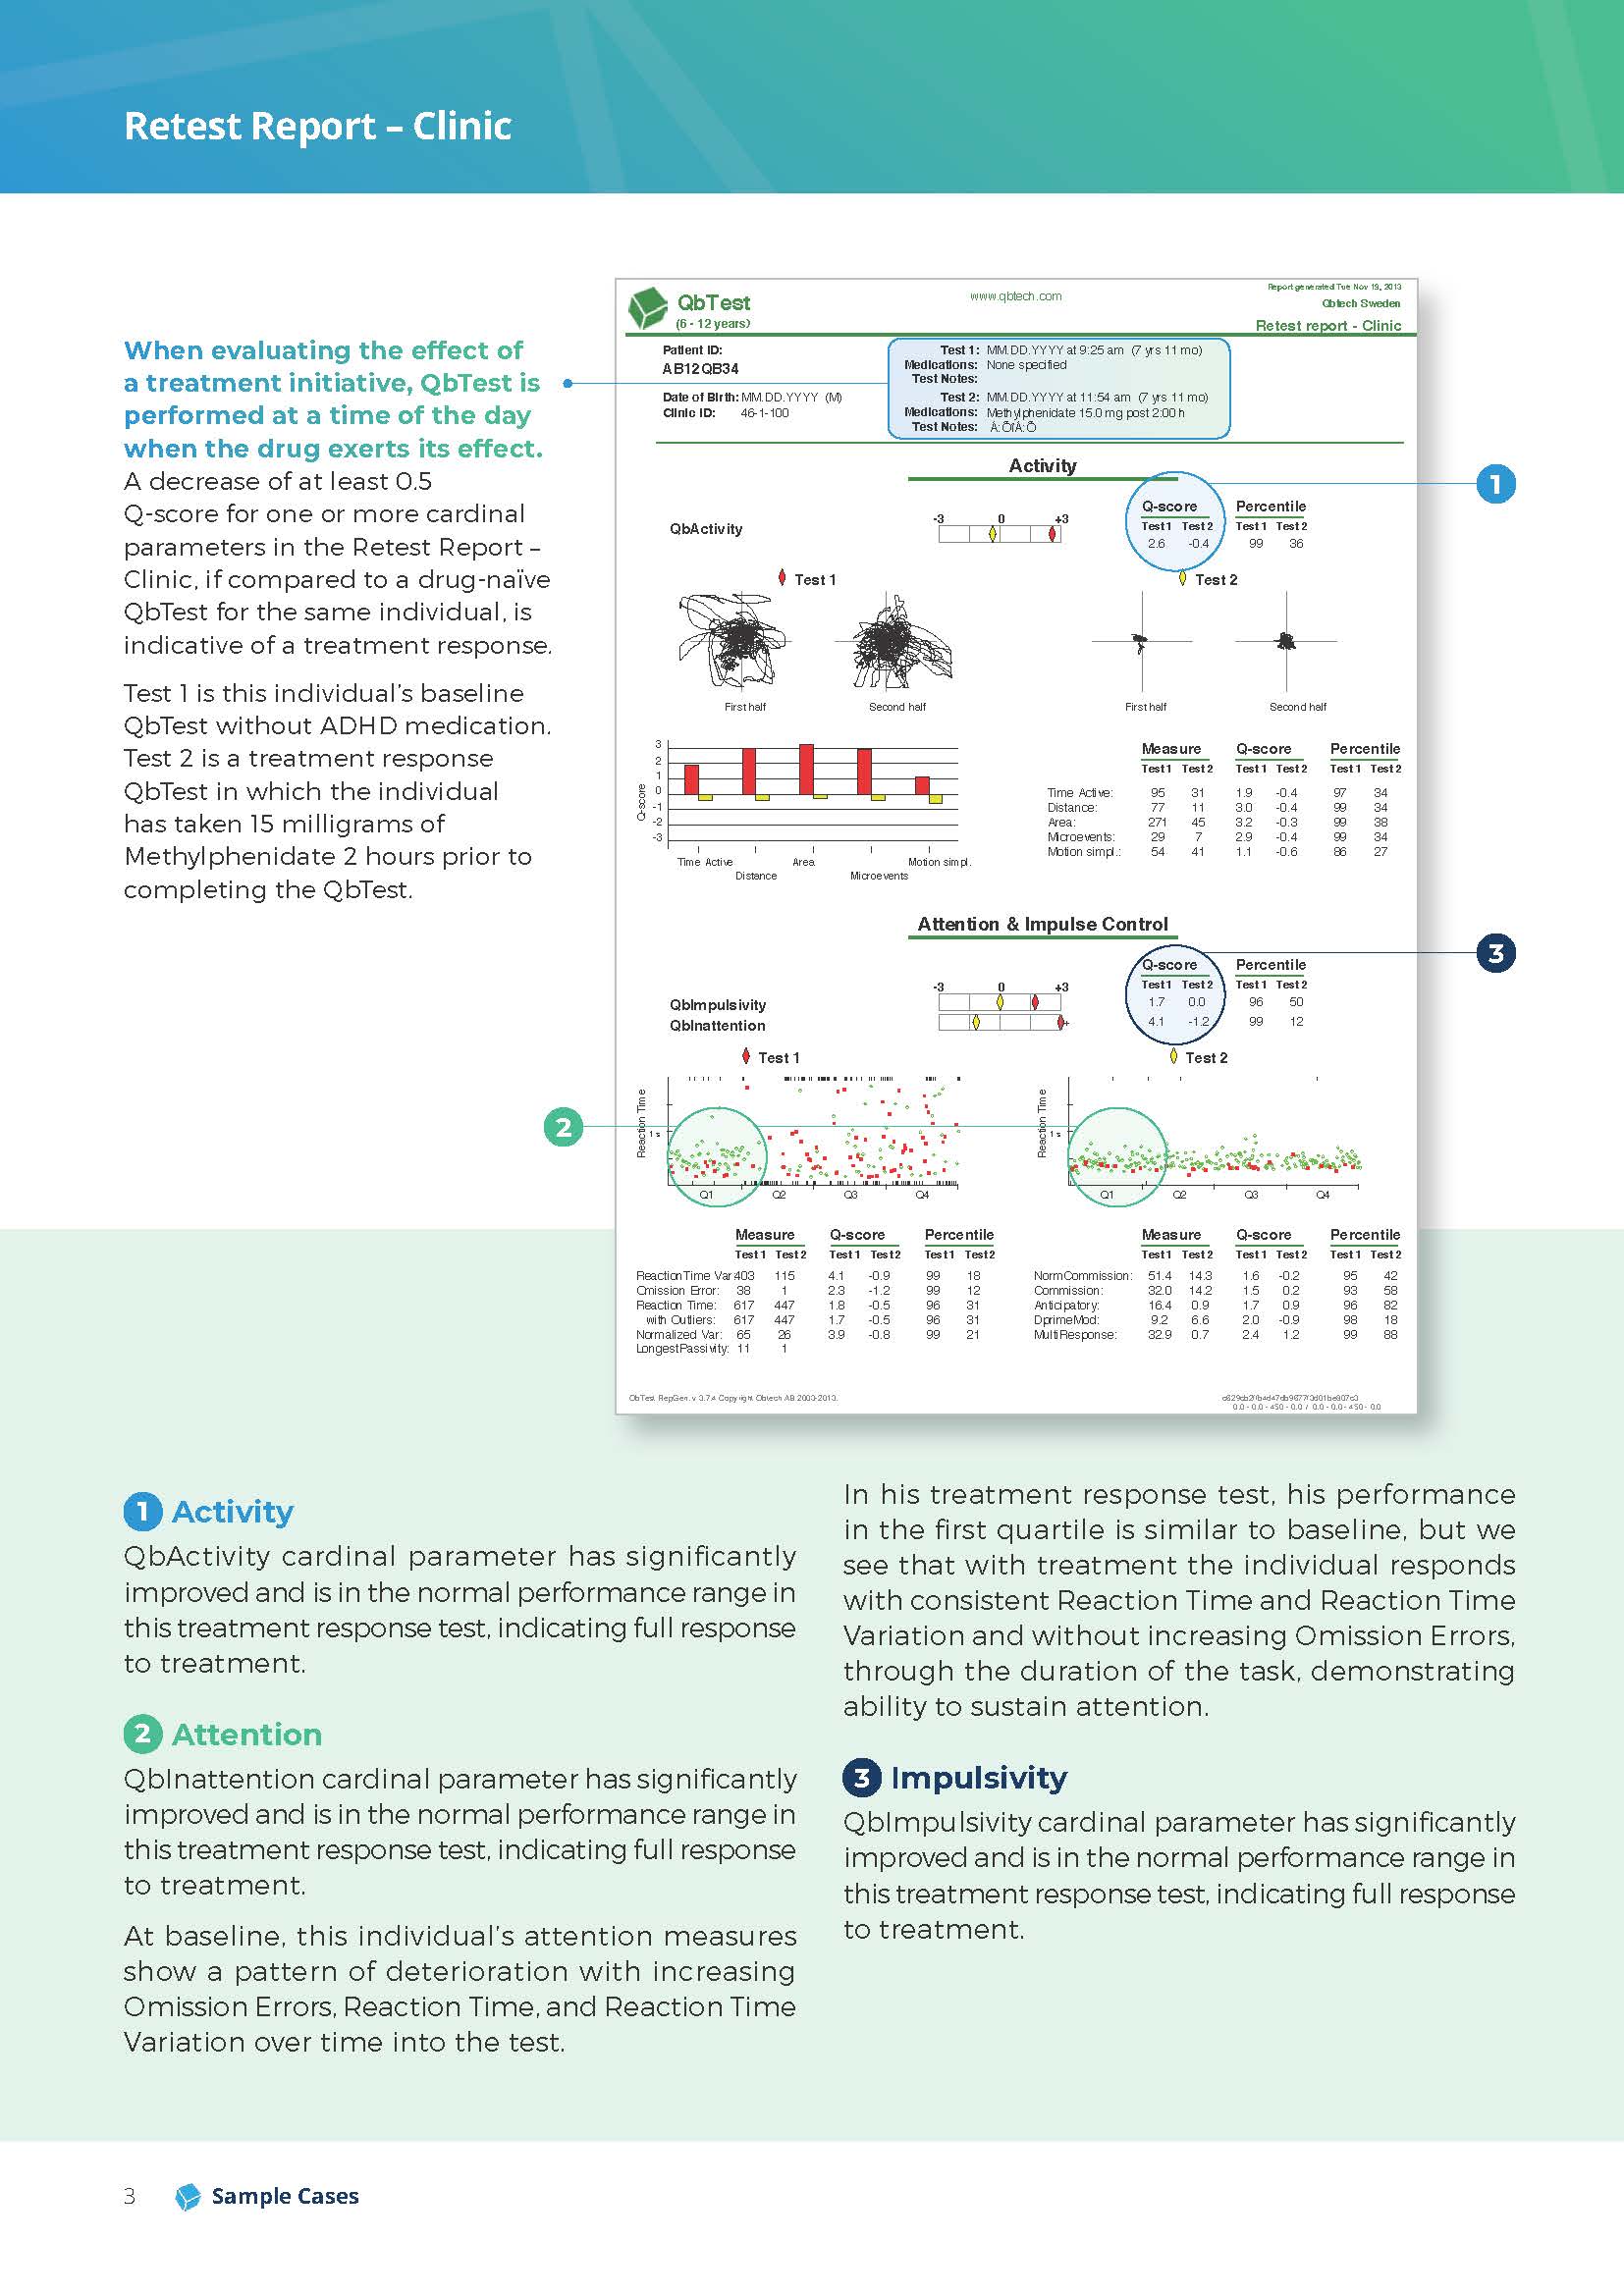
Designed by a team of clinical psychologists to be as accessible as possible, the tests’ main requirement is the ability to follow simple instructions. This technology is the only test on the market that specifically tracks hyperactivity using a camera, monitoring the actual movement of patients throughout the assessment. Results from the test can also be used to measure ADHD treatment effects.
Interpreting QbTest results
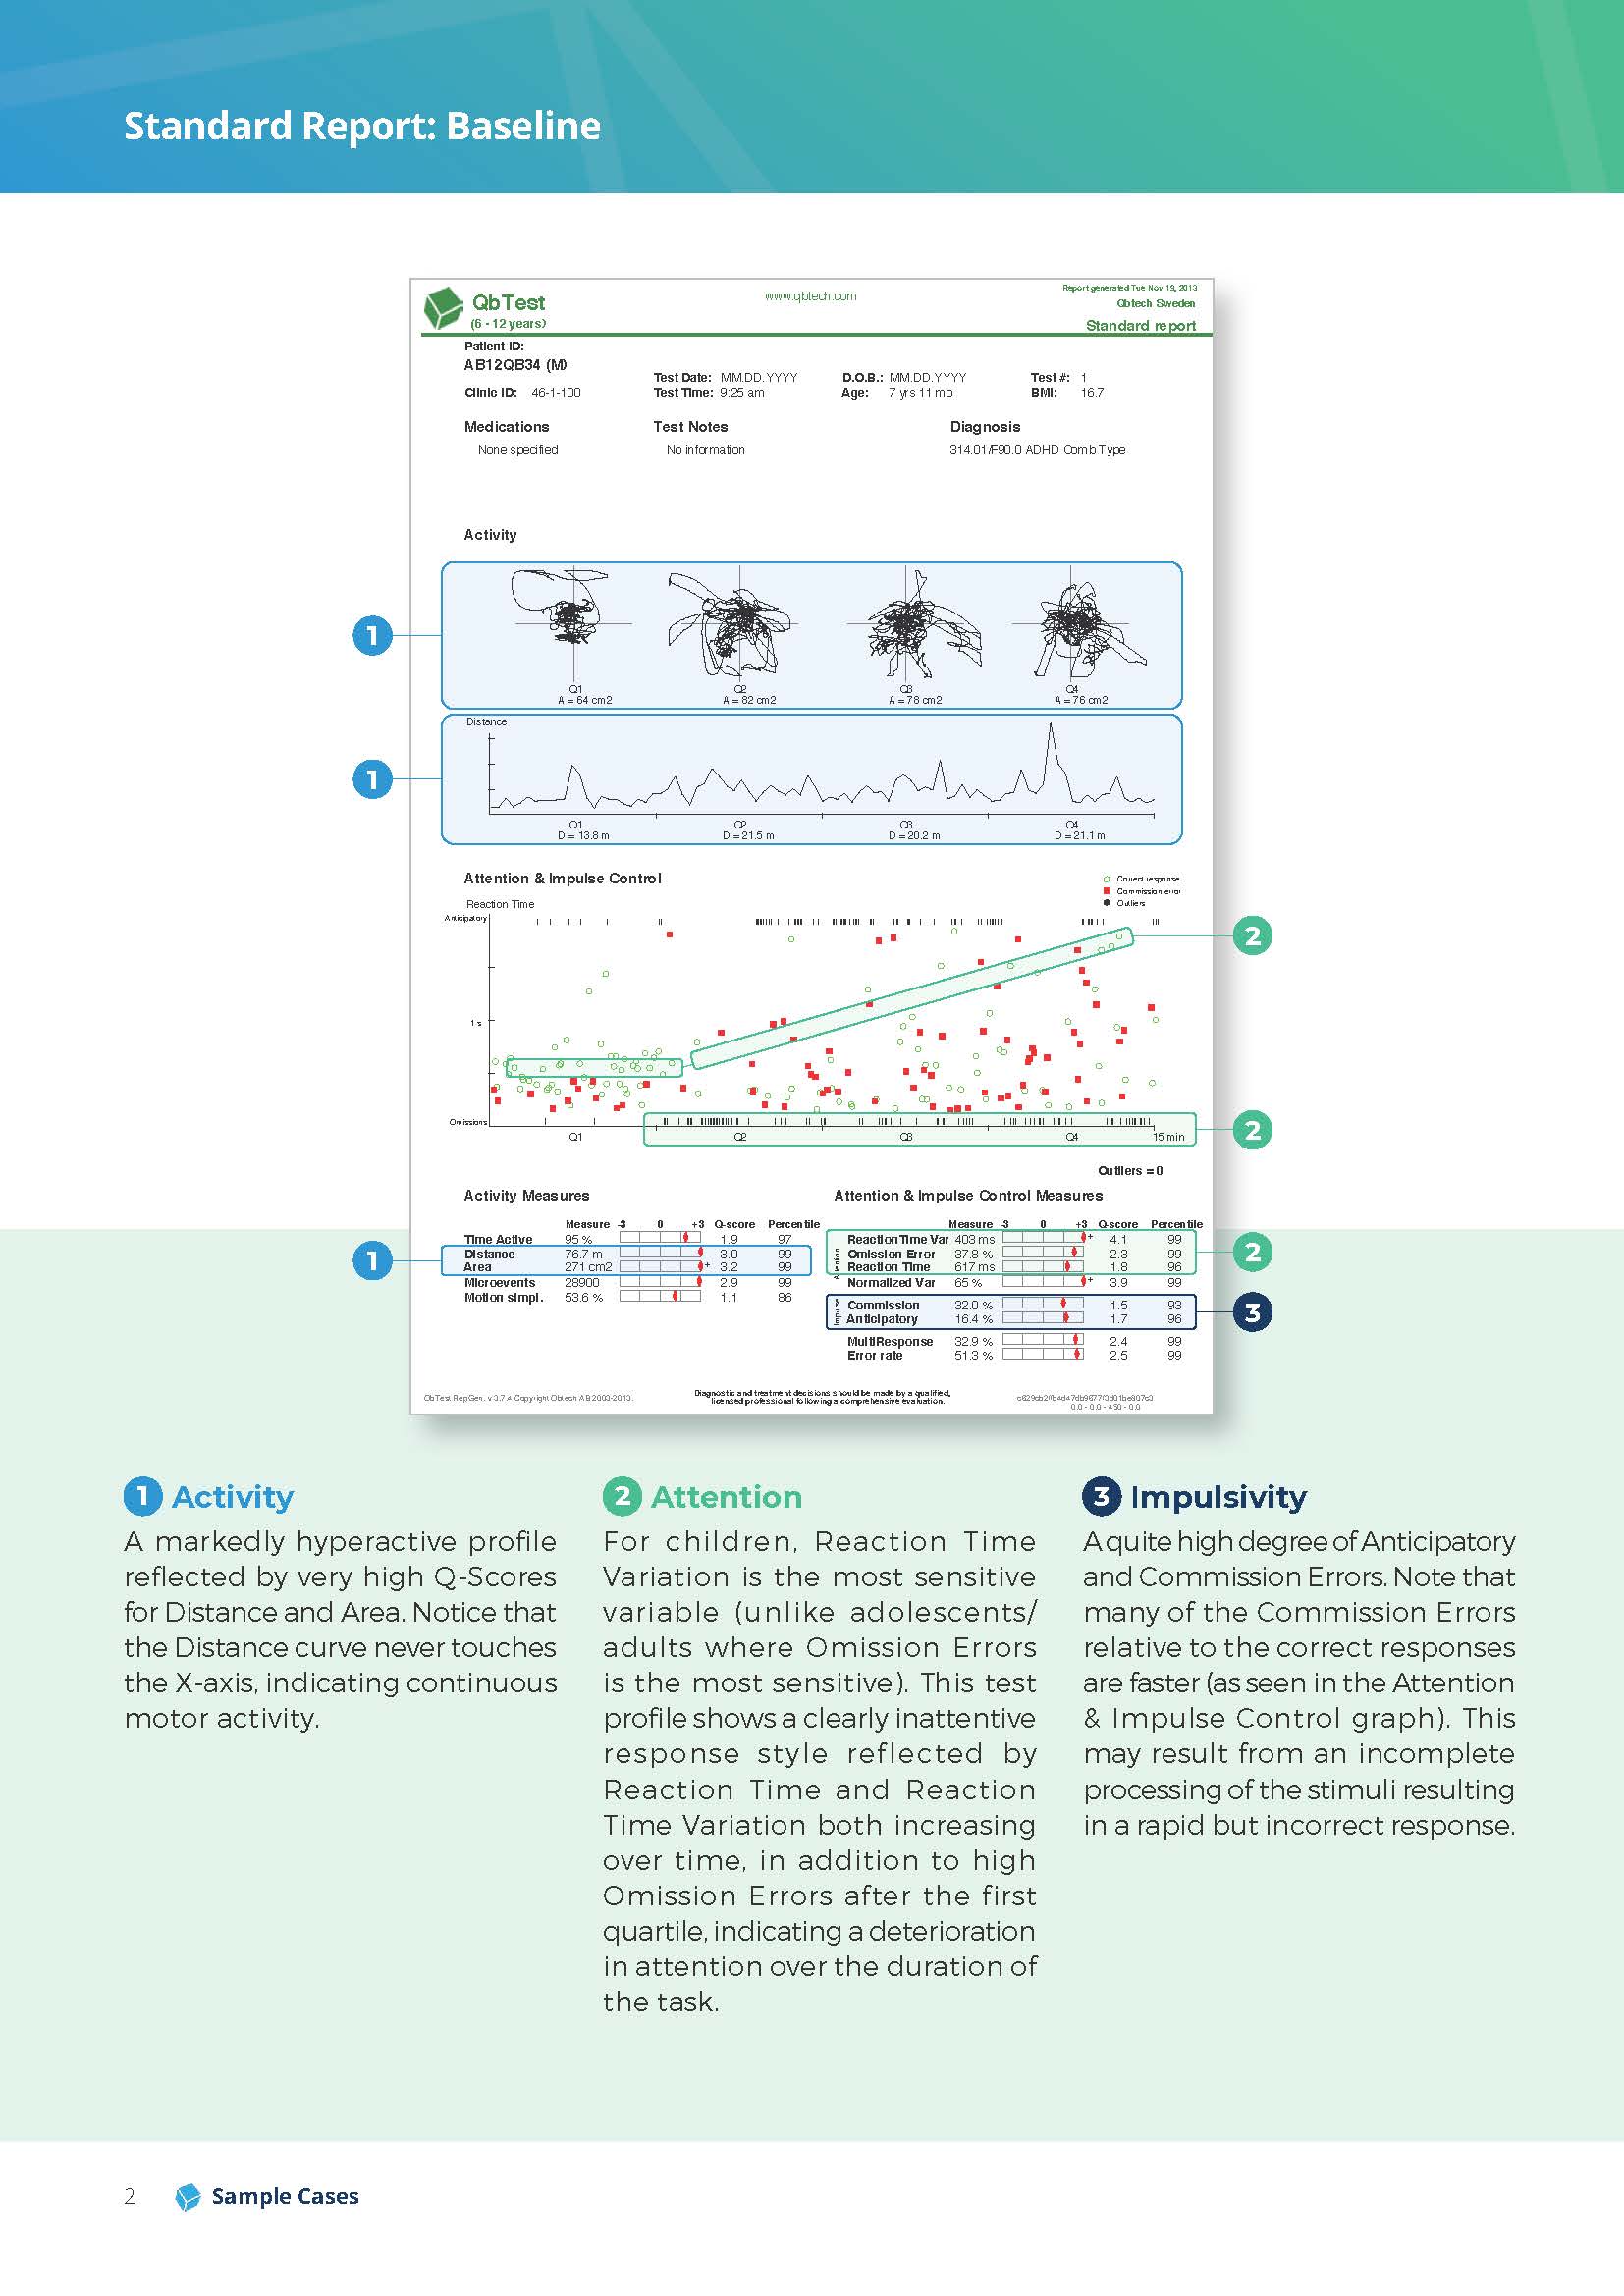
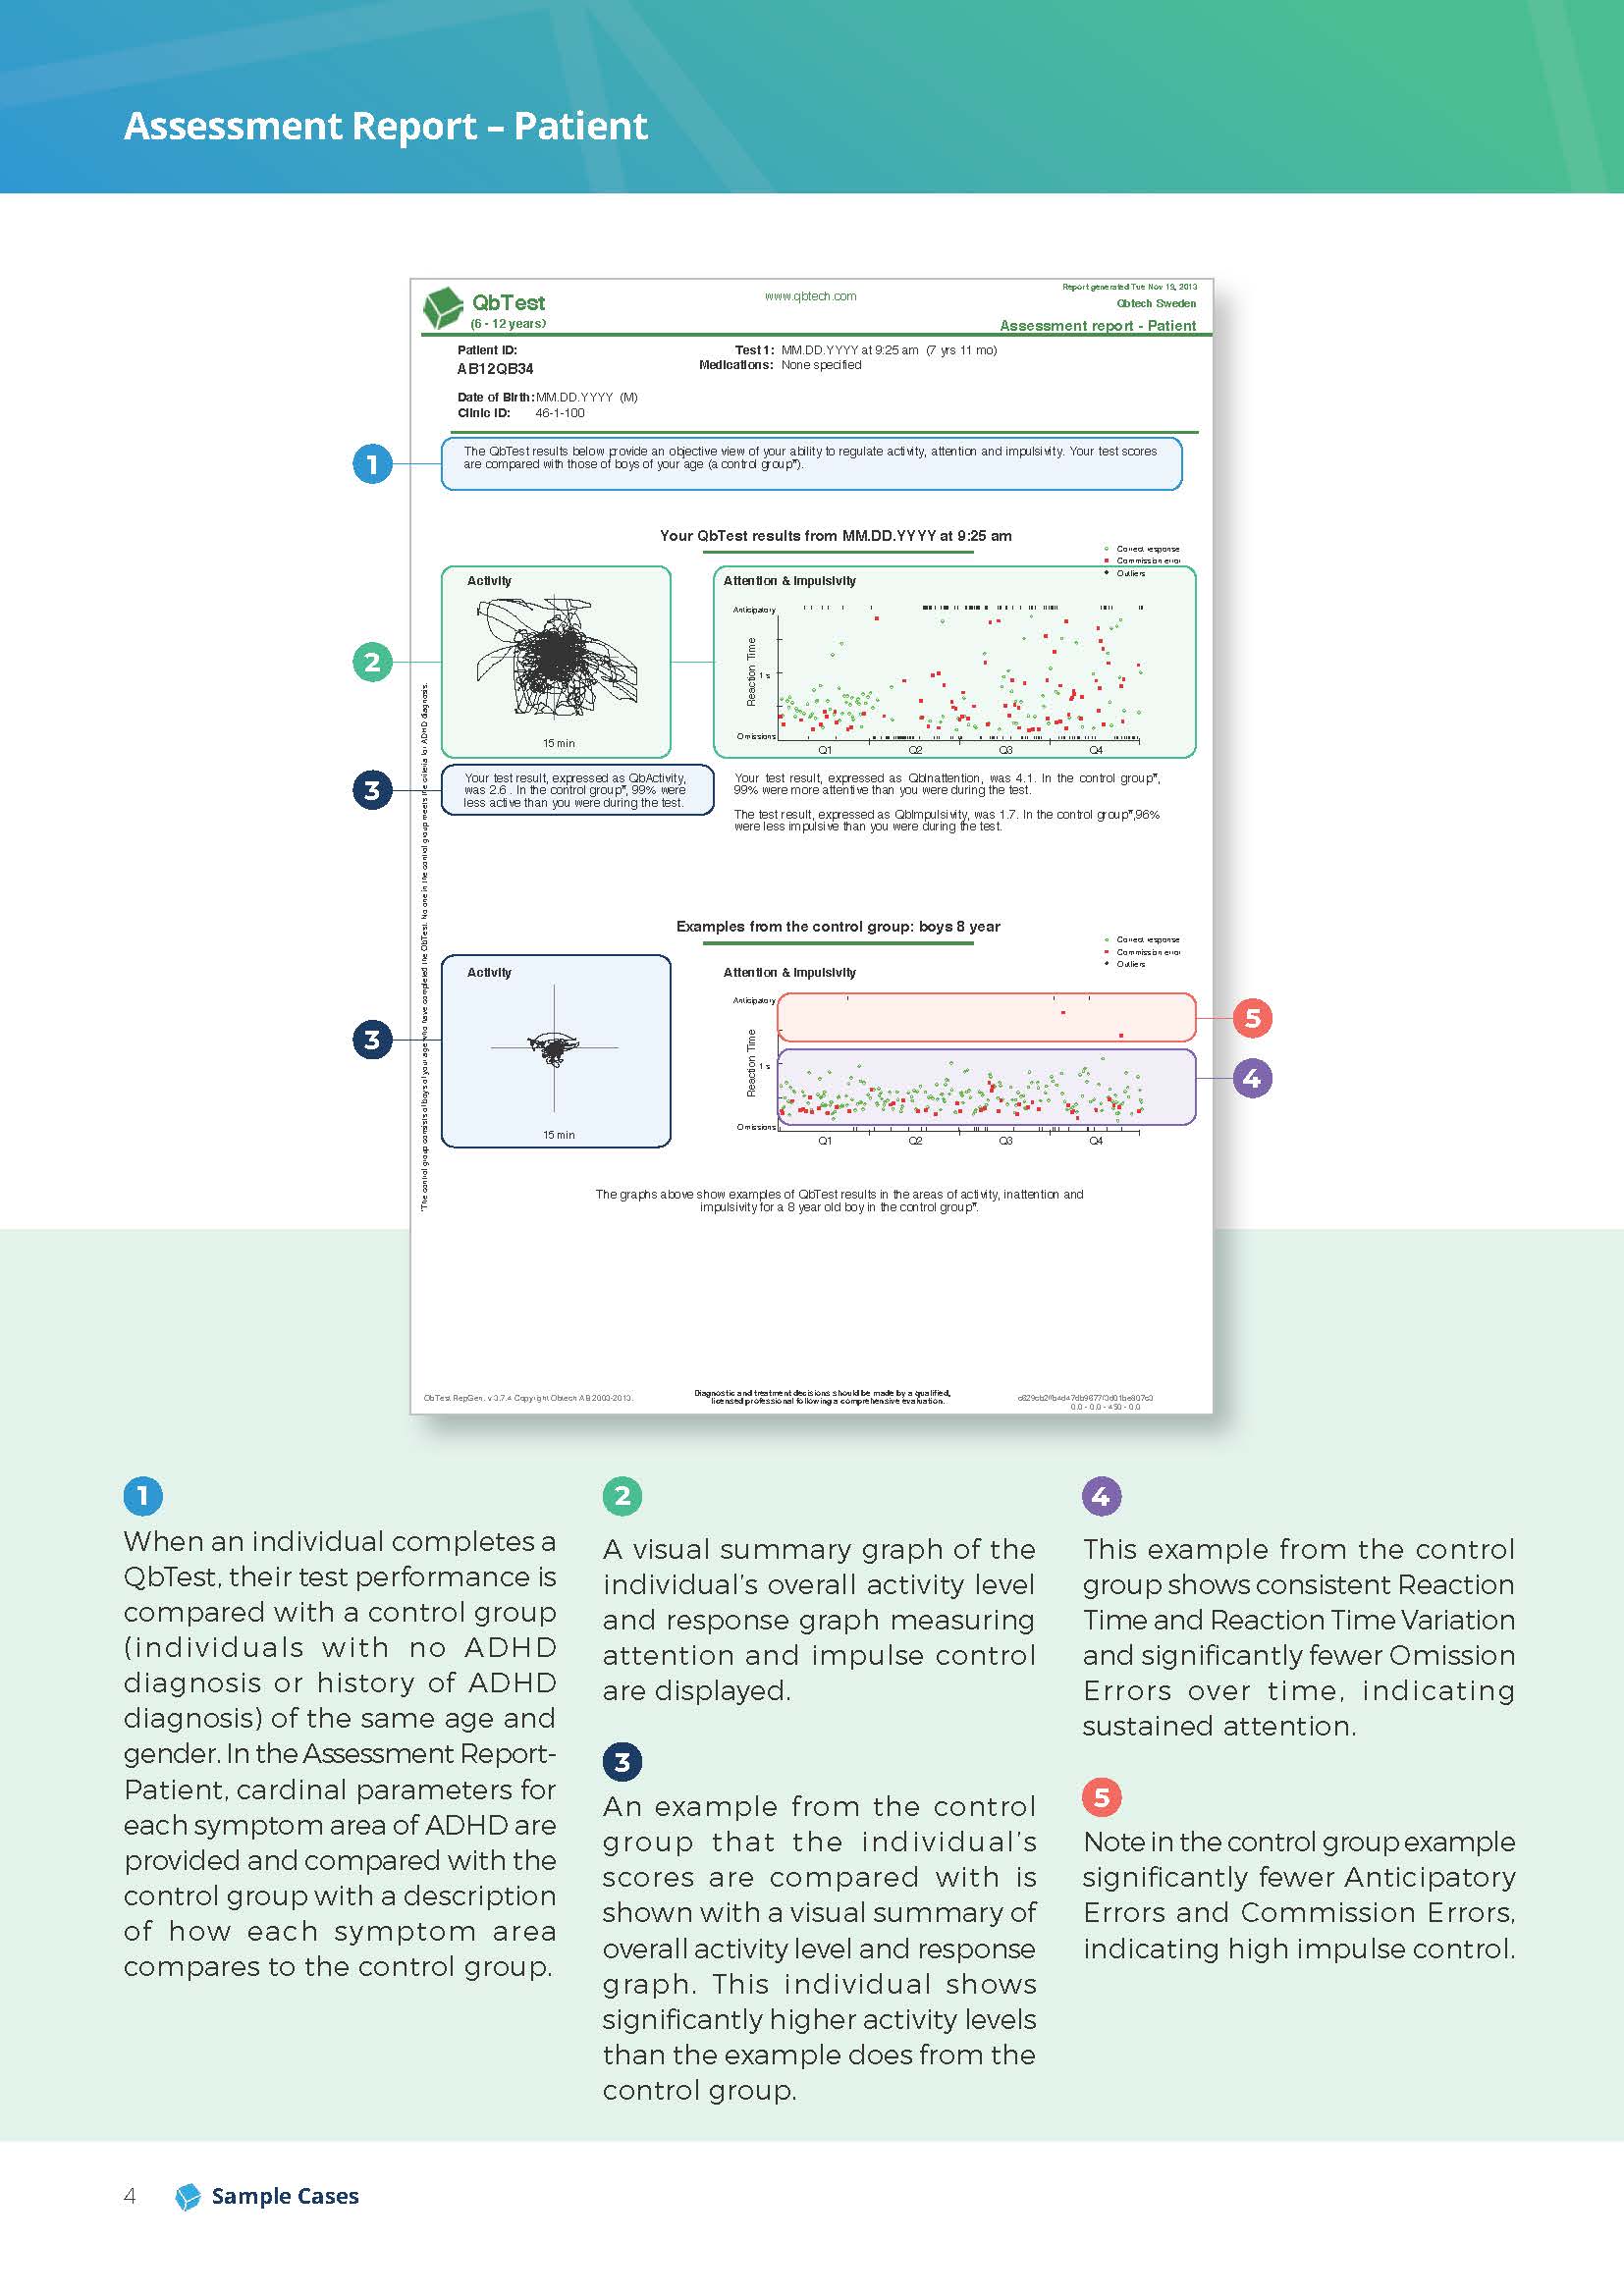
It’s a 15-20 minute computer-based test. QbTest data collected is compared to a normative age and sex-matched control group who don’t have ADHD and is broken down into four quartiles (every 5 minutes for the 20-minute version of the test). The report has a total of 13 parameters with three cardinal parameters – our statistically weighted scores that provide targeted insight into the three core symptom areas of ADHD and are listed as:
- QbActivity
- QbInattention
- QbImpulsivity
A patient report also clearly shows the individual’s activity graph and inattention/impulsivity graph compared to the age and sex matched control group.
Interpreting QbCheck results
QbCheck reports are similar to QbTest, showing five parameters that cover hyperactivity, inattentiveness, and impulsivity and a total symptom score for ADHD.
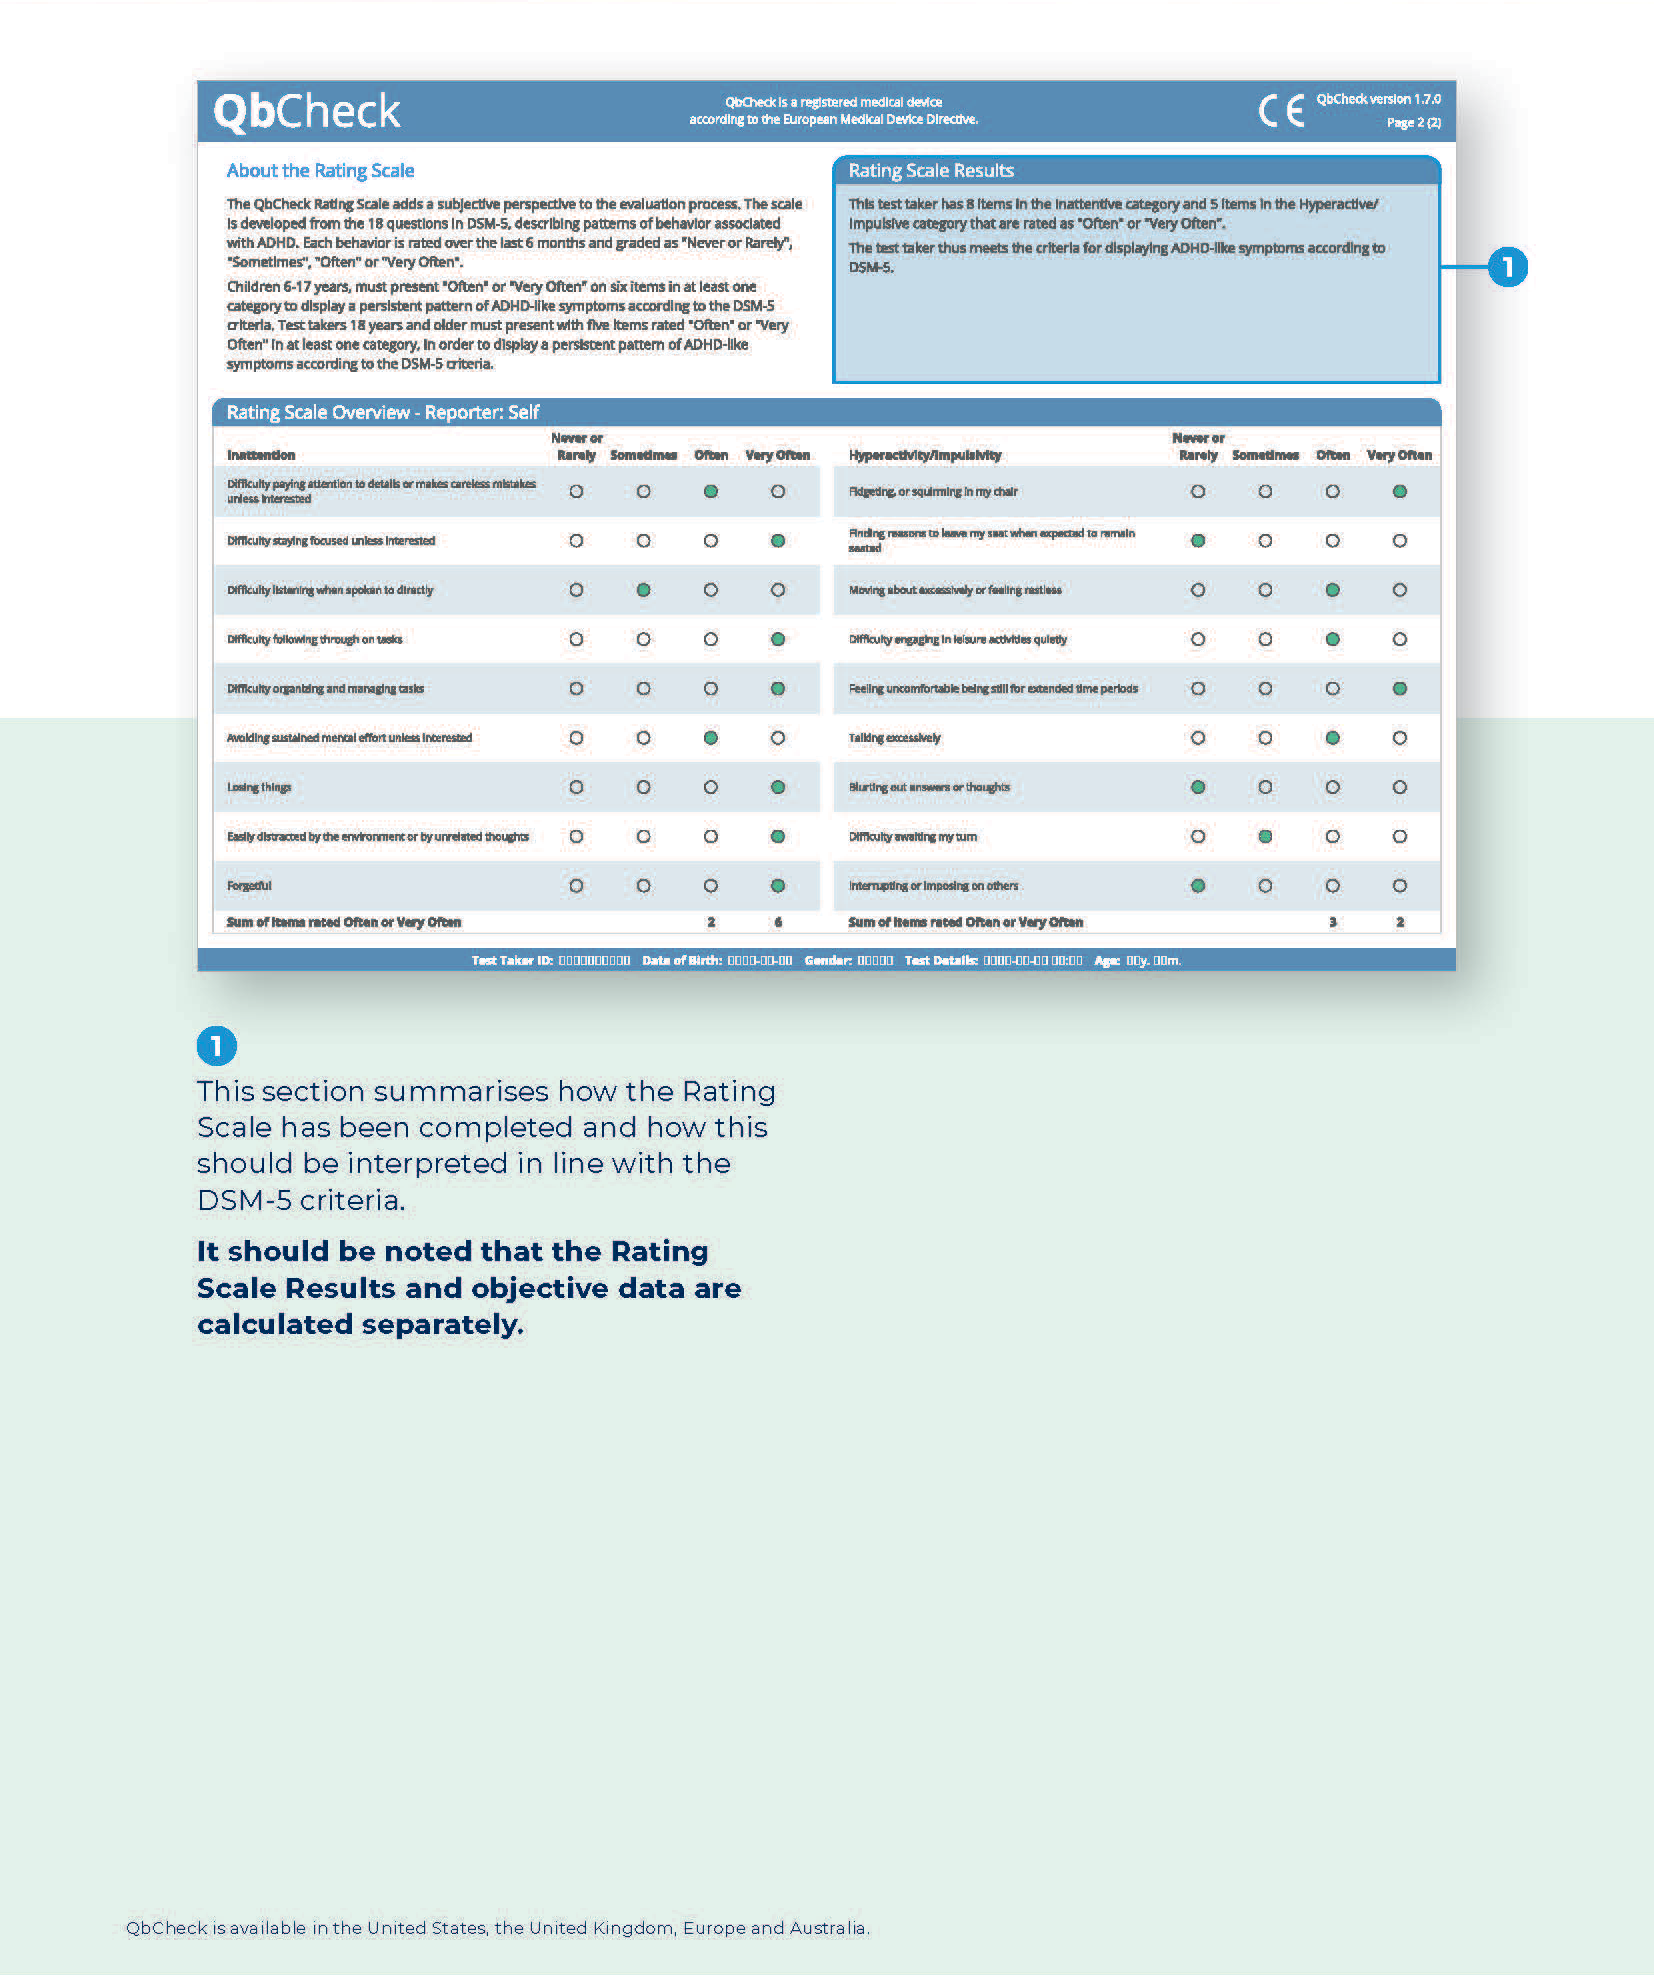
A key point of difference between QbTest and QbCheck is that the latter includes the DSM-5 ADHD Symptom Checklist. The QbCheck Rating Scale is developed from the 18 questions in DSM-5, describing patterns of behaviour associated with ADHD. Each behaviour is rated over the last six months and graded as “never or rarely”, “sometimes”, “often” or “very often.”
Children 6-17 years must present “often” or “very often” on six items in at least one category to display a persistent pattern of ADHD-like symptoms according to the DSM-5 criteria. Test takers 18 years and older must present with five items rated “often” or “very often” in at least one category, to display a persistent pattern of ADHD-like symptoms according to the DSM-5 criteria.
QbCheck also has a one-page report, with a side-by-side comparison of the individual to a sample case from their age and sex matched control group, a total symptom score, and the parameters.
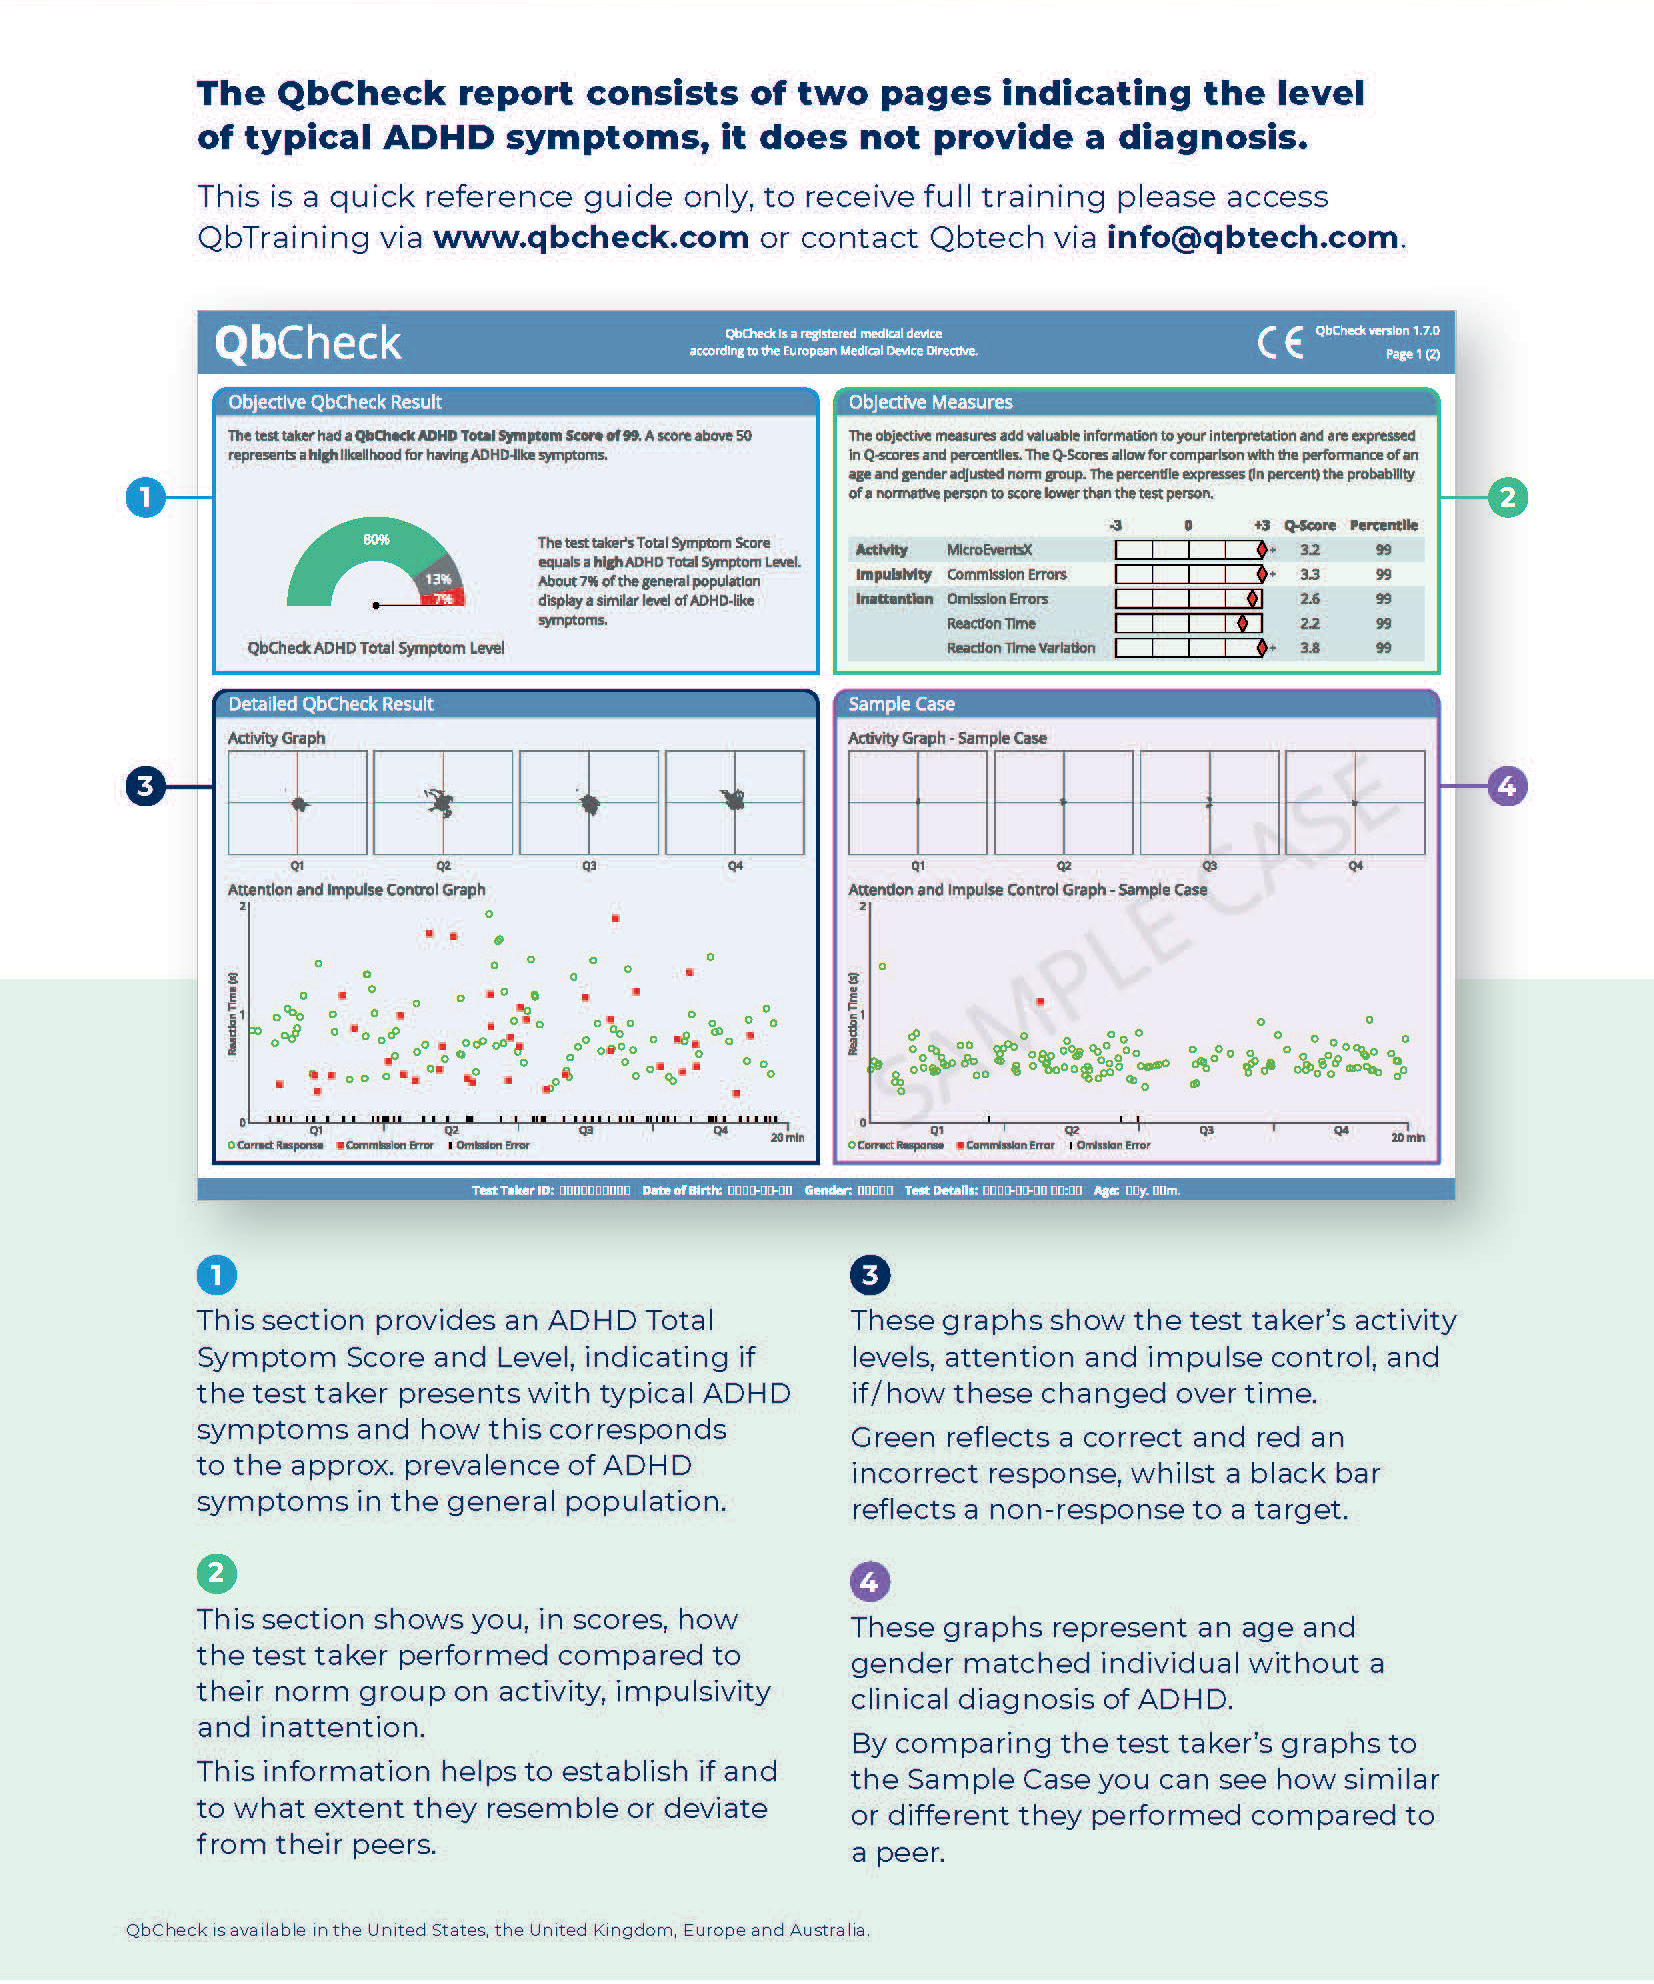
The inclusion of the activity graph gives you a visual representation of the test taker’s physical movements throughout the assessment (our graph draws a line showing where the individual moved during the test) and the attention and impulse control graph show the test taker’s responses to the task, including omission and commission errors.
Tracking omissions show the patient’s missed targets (each time they did not respond to a targeted stimuli) while commissions show responses to non-targeted stimuli (when the user is instructed to withhold their response, i.e. pressing the spacebar).
How you can make the right choice
The right objective test is based on your clinic’s needs. Find out which ADHD test is right for your clinic by completing the quiz. Find out more about virtual ADHD testing with our guide on how the remote function of QbCheck works.
The ability to objectively capture the three core symptoms of ADHD is invaluable to the differential diagnostic process. It allows you to take what you see clinically, what you hear from both your patient and their families, and compare with objective data to make an informed diagnostic decision.
QbTest and QbCheck provide data for clinicians like you to use as a routine part of your ADHD evaluation and treatment monitoring procedure.
Learn how your clinic can benefit from objective testing
Disclaimer: This is a quick reference guide and is in no way a substitute for clinical training. The purpose of this document is to give clinicians a bird’s eye view of what to expect when interpreting an objective ADHD test.
